
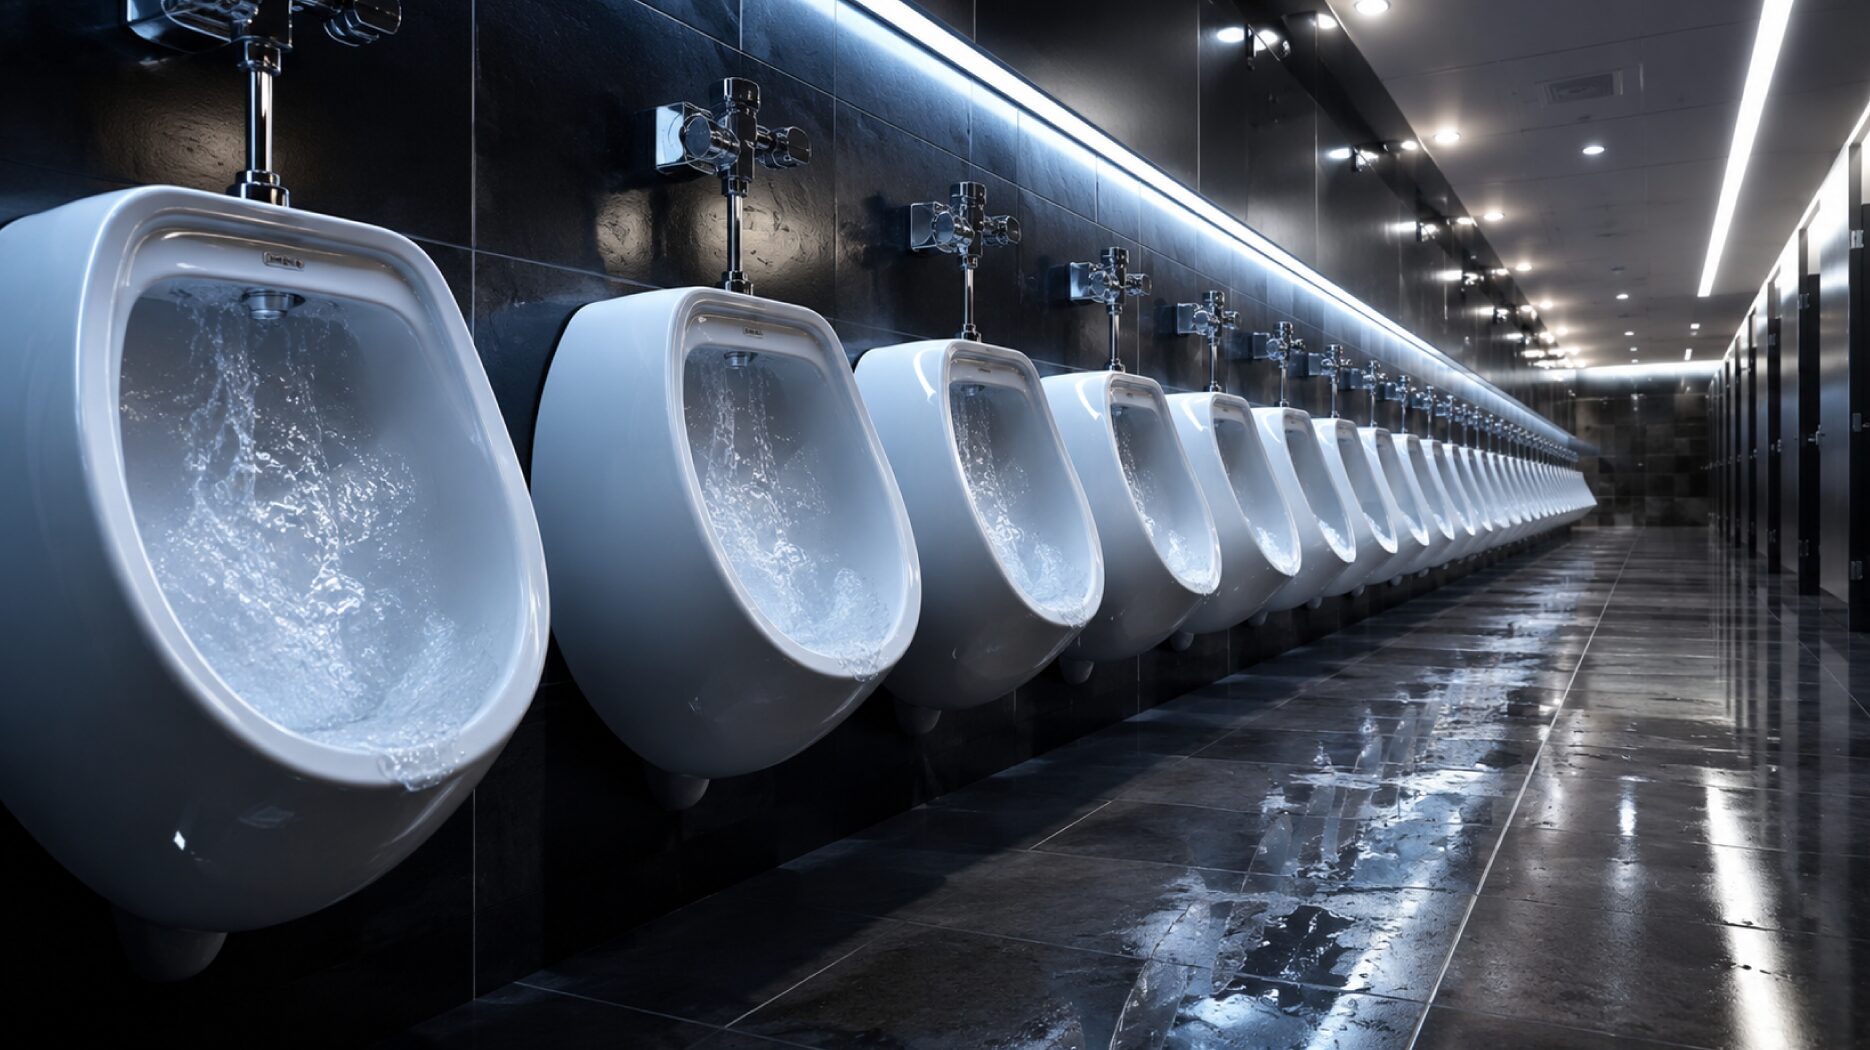

Before a new stadium opens its doors, engineers run a test with a name that says it all: the super flush. Every toilet and urinal in the building fires at once to prove the pipes can take the hit. There’s a good reason for the drama. When the halftime whistle blows at a World Cup match, tens of thousands of fans head for the restrooms in the same 15-minute window, and the plumbing has to win every time.
SupplyHouse calculated what that surge really looks like. Using each of the 16 host stadiums’ official capacities, the International Plumbing Code’s fixture minimums, and federal flow standards, we modeled the water moving through stadium restrooms at halftime, across a full match, and over the entire 104-match tournament. The totals are bigger than most fans would ever guess.
Key Takeaways
- A single halftime pushes 22,000 gallons (24.5 gallons every second) through the biggest World Cup stadium’s pipes, enough for nearly 1,300 average American showers in 15 minutes.
- The top three stadiums by halftime water flushed during a World Cup match: Estadio Azteca (Mexico City), MetLife Stadium (NY/NJ), and AT&T Stadium (Arlington).
- Even with every toilet and urinal running nonstop, only 1 in 7 fans (14%) can use the restroom during halftime, a rate that holds at every one of the 16 stadiums, no matter the size.
- The full 104-match tournament will flush an estimated 19.45 million gallons (or just over 147 million bottles of water) through stadium restrooms alone, before a drop is counted for concessions or field irrigation.
- U.S. stadiums carry nearly 80% of the load: an estimated 15.4 million gallons across the 11 American venues, led by MetLife Stadium, which moves more restroom water than any stadium in the tournament (~1.84 million gallons across its 8 matches, including the final), outflushing even the 9-match AT&T Stadium in Arlington.
When 80,000 Fans Head for the Restroom at Once
Building codes dictate how many toilets, urinals, and sinks a stadium must have for a crowd its size, and halftime puts every one of them to work at the same time.
Here’s what the 15-minute rush looks like across the 16 host stadiums:
- The 16 World Cup stadiums hold 1,033,829 fans, served by a code-required minimum of 19,312 plumbing fixtures.
- If every toilet and urinal at Estadio Azteca fired at once (the “super flush” test new stadiums actually run), 1,513 gallons would hit the drains in a single instant.
- Azteca’s halftime moves 22,018 gallons in 15 minutes, a sustained 24.5 gallons per second. Even the smallest venue, Toronto’s BMO Field, pushes nearly 12,000.
- Estadio Azteca (22,018 gallons), MetLife Stadium (21,954), and AT&T Stadium (19,287) top the halftime rankings.
- If all 16 stadiums hit halftime at the same moment, restrooms across three countries would move 283,012 gallons in 15 minutes.
- Running at maximum capacity, the fixtures can serve just 14% of the crowd before the second half kicks off.
How 104 Matches Add Up to 19.45 Million Gallons
Halftime is only the sprint; stretch the model across full match days and the complete tournament schedule, and the totals climb fast.
Match by match, here’s how the tournament’s water adds up:
- One match at Estadio Azteca sends 230,227 gallons through the restrooms, just over a third of an Olympic swimming pool.
- The 104-match tournament totals an estimated 19.45 million gallons, weighted by each venue’s actual match schedule.
- MetLife Stadium moves the most water of any venue (about 1.84 million gallons over eight matches), while 80,824-seat Azteca ranks just 11th with five matches. Schedule beats size.
- U.S. venues host 78 of 104 matches and account for roughly 15.4 million gallons, nearly 80% of the tournament’s total flush volume.
- The infrastructure built for this kind of surge is enormous. Globe Life Field in Arlington, a comparable venue, runs on 26 miles of pipe and roughly 2,600 plumbing fixtures.
Methodology
To calculate how much water moves through a stadium during a World Cup match, we started with the official capacity of each of the 16 host stadiums as confirmed by FIFA. We then used the International Plumbing Code, the building code most U.S. jurisdictions follow, to determine the minimum number of toilets, urinals, and sinks each stadium must have for a crowd its size. Because most stadiums don’t publish their exact fixture counts, we used these code minimums for every venue; since real stadiums build more restrooms than the code requires, our figures are conservative.
We then applied the maximum water use allowed under the Energy Policy Act of 1992 (1.6 gallons per toilet flush, 1 gallon per urinal flush, and about half a gallon per handwash) to model three scenarios: every fixture flushing at once (a real test new stadiums run, known as the “super flush”), every fixture running nonstop during the 15-minute halftime, and a full match day.
For halftime, we assumed each toilet turns over every 90 seconds and each urinal every 60 seconds, with a handwash after every use. For a full match, we assumed each fan uses the restroom 1.5 times over a three-to-four-hour stadium visit. Tournament-wide totals multiply each stadium’s per-match water use by the number of matches it actually hosts (from nine in Arlington to four in Guadalajara and Monterrey) and assume sold-out crowds. Our figures cover restroom water only; concessions, kitchens, and field irrigation are not included.
About SupplyHouse
SupplyHouse is a trades-first online supplier built for the pros who keep water moving where it belongs. From plumbing supplies to heating, cooling, and electrical essentials, SupplyHouse combines expert product knowledge with fast nationwide delivery, so the parts show up when the job needs them.
Fair Use Statement
Feel free to share this data and these graphics for noncommercial purposes. All we ask is that you link back to this page on SupplyHouse so readers can find the full findings and methodology.