

SupplyHouse surveyed 1,001 U.S. homeowners to see how long people wait to fix common plumbing and HVAC problems, why they wait, and what those delays cost when the bill finally lands. Among homeowners who waited six months or longer, the bill for the same kind of repair more than doubled.
Key Takeaways
- 93% of homeowners delay plumbing or HVAC repairs at least sometimes, with only 7% saying they never put a repair off.
- 26% of homeowners paid more than they expected for their most recent plumbing or HVAC repair.
- 13% of homeowners waited six months or longer to address their most recent issue, including 8% who have not addressed it at all.
- 71% of homeowners tried a DIY fix before calling a pro, and 51% of those attempts either didn’t resolve the issue or made it worse.
- 21% of homeowners have hidden a home repair issue from a spouse, partner, or roommate to dodge the cost conversation.
- 49% of homeowners who delayed a repair by a month or more paid for it with credit cards, loans, payment plans, or borrowed money.
64% of homeowners thought their issue wasn’t serious when they first noticed it, and 56% of those issues went on to get worse.
The Delay Timeline
A handful of homeowners pick up the phone the day something goes wrong. Most don’t. The lag between “noticed it” and “fixed it” tells the first part of the story.
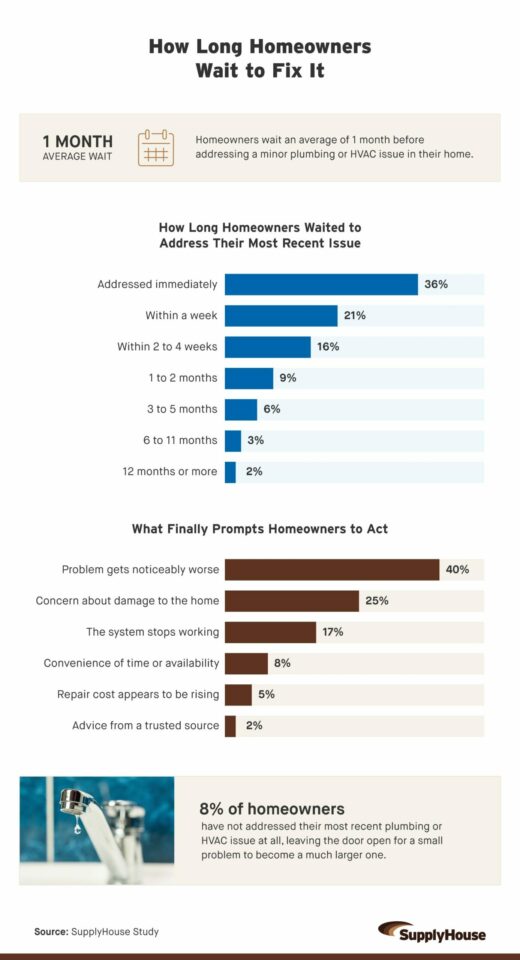
Homeowners wait an average of one month before addressing a minor plumbing or HVAC issue. That average pulls together a wide range of responses. About a third (36%) acted immediately, and 21% had the problem handled within a week. From there, the timeline stretches out: 16% waited two to four weeks, 9% waited one to two months, and 19% waited three months or longer. Inside that last group, 8% haven’t addressed the issue at all.
Minor plumbing leaks (30%) and clogged drains (27%) were the two issues homeowners put off the longest. They’re easier to live with in the short term and easy to rationalize as low priority, even though both can cause damage as they sit.
What finally pushes a homeowner to act is usually the problem getting worse:
- 40% said they called for help once the issue noticeably escalated.
- 25% acted out of concern about damage to the home.
- 17% waited until the system stopped working entirely.
Only 8% cited scheduling convenience, 5% pointed to rising repair costs, and 2% acted on advice from a trusted source. Nearly half of homeowners (49%) said they only call a professional when something breaks (33%) or don’t schedule maintenance at all (16%).
Generation and income shape the timeline, too. Baby boomers were the quickest to act, with 45% addressing their most recent issue immediately, compared with 34% of Gen X, 35% of millennials, and 31% of Gen Z. As for income, 11% of homeowners earning under $50,000 still hadn’t addressed their most recent issue, versus 5% of those earning $100,000 or more.
Why Small Problems Get Pushed Off
Cost gets blamed most often, but it isn’t the only reason homeowners stall. Many are also working with an incomplete picture of how serious the issue really is.
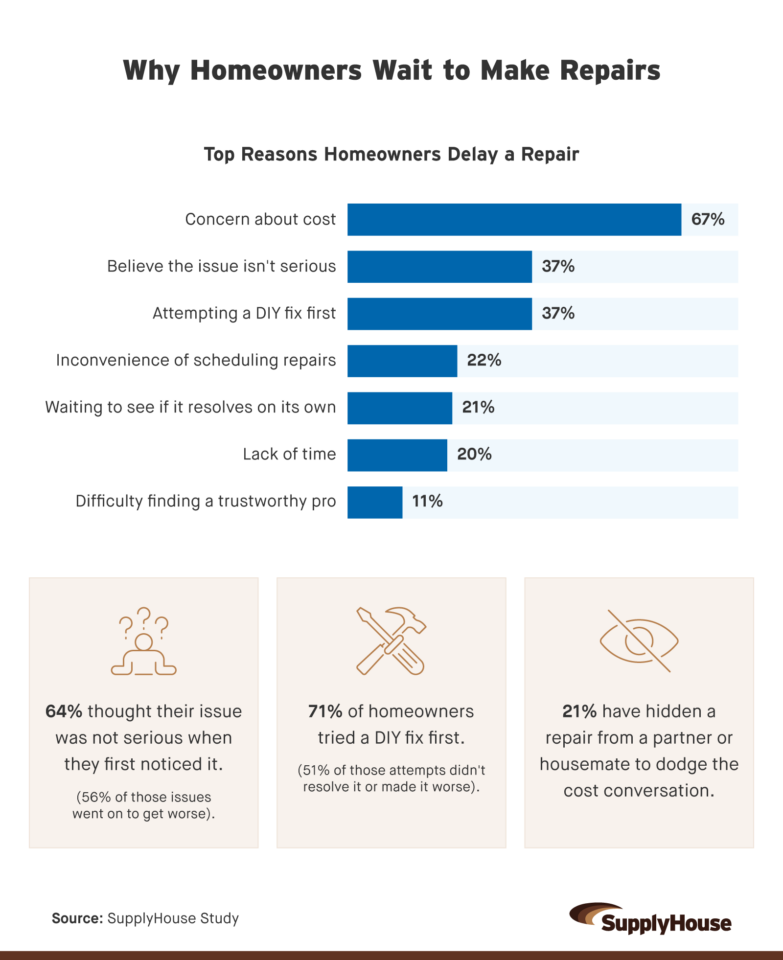
Cost concern was by far the leading reason homeowners delayed a repair, cited by 67% of respondents and ahead of every other factor by at least 30 points. Other reasons included the following:
- 37% believed the issue wasn’t serious.
- 37% wanted to try a DIY fix first.
- 22% found scheduling repairs inconvenient.
- 21% were waiting to see if it would resolve on its own.
- 20% didn’t have time to deal with it.
- 11% struggled to find a trustworthy pro.
The “not serious” read tends to be wrong more often than right. Overall, 64% of homeowners thought their issue was not serious or only slightly serious when they first noticed it. But then 56% of those issues eventually got worse.
DIY didn’t fare much better. Among the 71% of homeowners who attempted a fix on their own before calling a professional, 51% said those attempts either didn’t resolve the issue or made it worse. DIY was more common among younger homeowners (76% of millennials and 76% of Gen Z, versus 69% of Gen X and 52% of baby boomers) and peaked in the $75,000 to $99,999 income bracket, where 76% gave it a shot. Homeowners earning $150,000 or more were the least likely to try (58%).
About one in five homeowners (21%) admitted to hiding a home repair issue from a spouse, partner, or roommate to dodge the cost conversation. Gen X led the group at 25%, followed by millennials (22%), baby boomers (12%), and Gen Z (11%). But the rate was identical for male and female homeowners, at 21% each.
When Delays Turn Into Bigger Bills
The financial side of waiting is where the math gets uncomfortable. Same kind of issue, very different price tag depending on how long it sat.
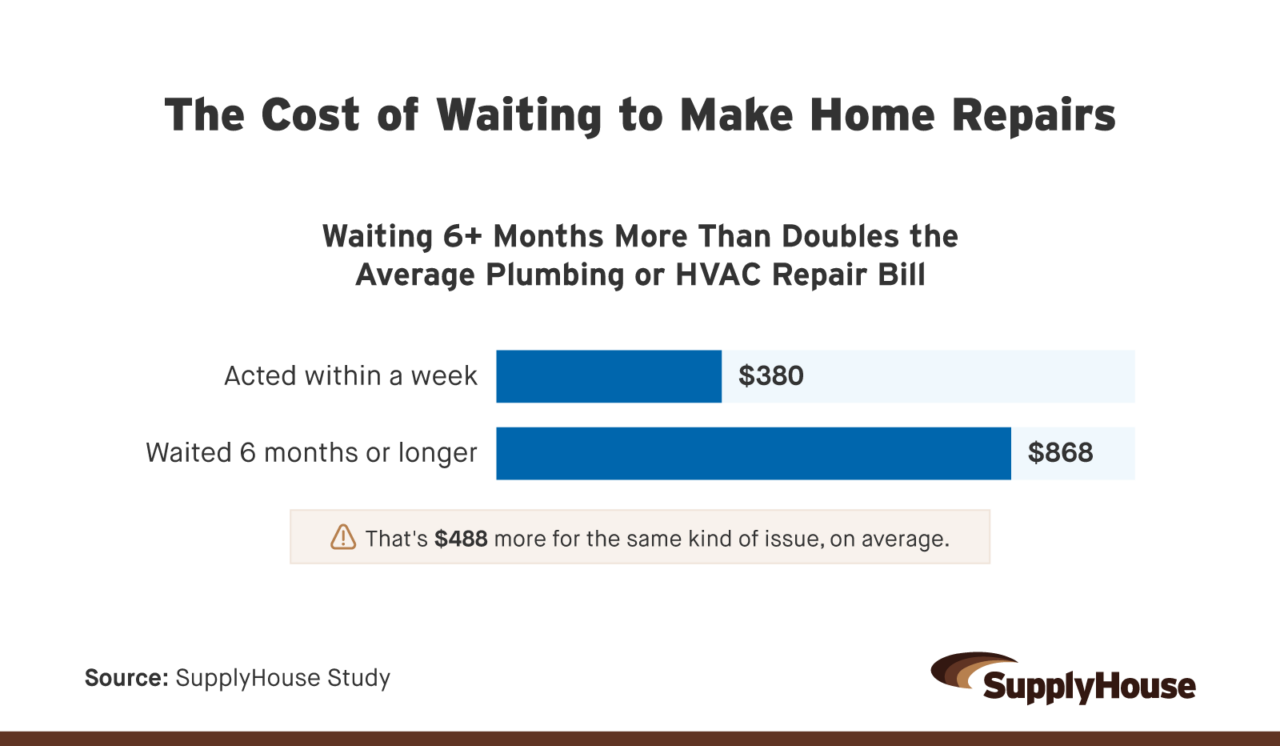
More than half of homeowners (59%) said their issue got worse after they first noticed it, with 33% reporting it worsened in less than a month. Homeowners who acted within a week paid an average of $380 for their repair. Those who waited six months or longer paid $868, a difference of $488.
While 54% of homeowners paid about what they expected the repair to cost, 20% paid less. Another 26% paid more than expected. The average homeowner paid $486 against an expected $424, a $62 gap. Respondents earning under $25,000 saw a $137 average overage, more than three times the overage for those earning $25,000 to $49,999 ($34).
Cost surprises hit younger homeowners hardest:
- Gen Z overran their expectations by an average of $138, well above millennials ($48), Gen X ($62), and baby boomers ($70).
- 31% of Gen Z paid more than expected, compared with 26% of millennials, 27% of Gen X, and 21% of baby boomers.
To cover the repair bill, 44% of all homeowners used credit cards, loans, payment plans, or borrowing to pay for their most recent repair. That figure climbed to 49% among homeowners who had delayed the repair by a month or more. Credit card use was highest in the upper income brackets: 45% of homeowners earning $100,000 or more reached for a credit card, including 52% of those earning $150,000 or more. Baby boomers were the least likely to borrow from family or friends (1%), while 7% of Gen Z did.
The Real Math of Maintenance
For most homeowners, the choice to wait is rational in the moment. Cost feels manageable later, the problem doesn’t look serious yet, and DIY is worth a shot. But the version of the repair that’s waiting six months from now is usually a bigger, costlier one. A small problem caught at week one is a much cheaper problem than the same one at month six.
Methodology
We surveyed 1,001 U.S. homeowners in 2026 through Connect, an online research panel, to measure how long homeowners delay essential plumbing and HVAC repairs and the financial cost of those delays. The demographics of respondents are as follows:
- Gender: 59% female, 40% male, 1% nonbinary or another gender identity
- Generation: 49% millennials (ages 30 to 45), 32% Gen X (ages 46 to 61), 12% baby boomers (62 or older), 7% Gen Z (ages 18 to 29)
- Annual personal income: 16% earned under $25,000, 19% earned $25,000 to $49,999, 22% earned $50,000 to $74,999, 17% earned $75,000 to $99,999, 17% earned $100,000 to $149,999, and 9% earned $150,000 or more
About Supply House
SupplyHouse is a trusted online supplier that combines expert-level product knowledge and fast nationwide fulfillment to make finding and buying plumbing, heating, cooling, and electrical supplies simple and reliable for both professionals and homeowners.
Fair Use Statement
The information in this article may be used for noncommercial purposes only. If shared, proper attribution with a link back to SupplyHouse must be included.