


When a heat wave rolls in, the AC becomes the most important appliance in the house, and the tech who can fix it becomes the most important person in town. Extreme summer heat puts real strain on homes, public health, and the tradespeople who keep cooling systems running when everyone needs them at once. To see where that strain lands hardest, we ranked the 70 largest U.S. metro areas across the climate, workforce, public-health, and search-demand factors tied to extreme-heat vulnerability.
Key Takeaways
- Laredo, TX, ranks #1 overall as America’s most heat-vulnerable metro.
- Madison, WI, is the least heat-vulnerable metro, driven mainly by mild summers (80.2°F average high), one of the lowest heat-health vulnerability scores in the country (26.1 percentile), and modest cooling demand.
- Phoenix, AZ, is the hottest metro in America (105.2°F average summer high).
- Corpus Christi, TX, is America’s fastest-warming metro for extreme heat, adding 16.3 more days above 90°F in recent years.
Where Heat Vulnerability Is Highest
The hottest city isn’t always the most vulnerable one. What matters is whether a metro has the workforce to keep up when the heat hits, and that’s where many fall short. Our ranking weighs a metro’s heat, its residents’ health risk, and how hard people are searching for emergency repairs, but it leans most heavily on technician scarcity. When everyone’s AC breaks at once, the shortage of people who can fix it is what turns a hot week into a crisis. The higher a metro’s score, out of 100, the more vulnerable it is.
Top 10 Most Vulnerable Metros
- Laredo, TX: 74.65
- Stockton, CA: 70.06
- El Paso, TX: 64.32
- Bakersfield, CA: 62.68
- Corpus Christi, TX: 60.58
- Lubbock, TX: 59.78
- Las Vegas–Henderson–Paradise, NV: 58.72
- Houston–The Woodlands–Sugar Land, TX: 58.25
- Phoenix–Mesa–Chandler, AZ: 57.28
- San Antonio–New Braunfels, TX: 57.03
Top 10 Least Vulnerable Metros
- Madison, WI: 20.71
- Washington–Arlington–Alexandria, DC-VA-MD-WV: 20.80
- Richmond, VA: 21.25
- Greensboro–High Point, NC: 21.88
- Boston–Cambridge–Newton, MA-NH: 25.00
- Cape Coral–Fort Myers, FL: 25.11
- San Francisco–Oakland–Berkeley, CA: 25.75
- Detroit–Warren–Dearborn, MI: 25.89
- Virginia Beach–Norfolk–Newport News, VA-NC: 26.14
- Cincinnati, OH-KY-IN: 27.88
Breaking Down the Heat Vulnerability Rankings
- Not every metro is heating up. Some show negative growth, meaning their most recent summers (2021–2025) actually had fewer extreme-heat days than their 1991–2020 average. This isn’t evidence that these cities are cooling long-term, but rather reflects natural year-to-year swings in summer weather. Here’s a closer look at the five factors behind the rankings, and which metros stand out as most and least vulnerable in each category.
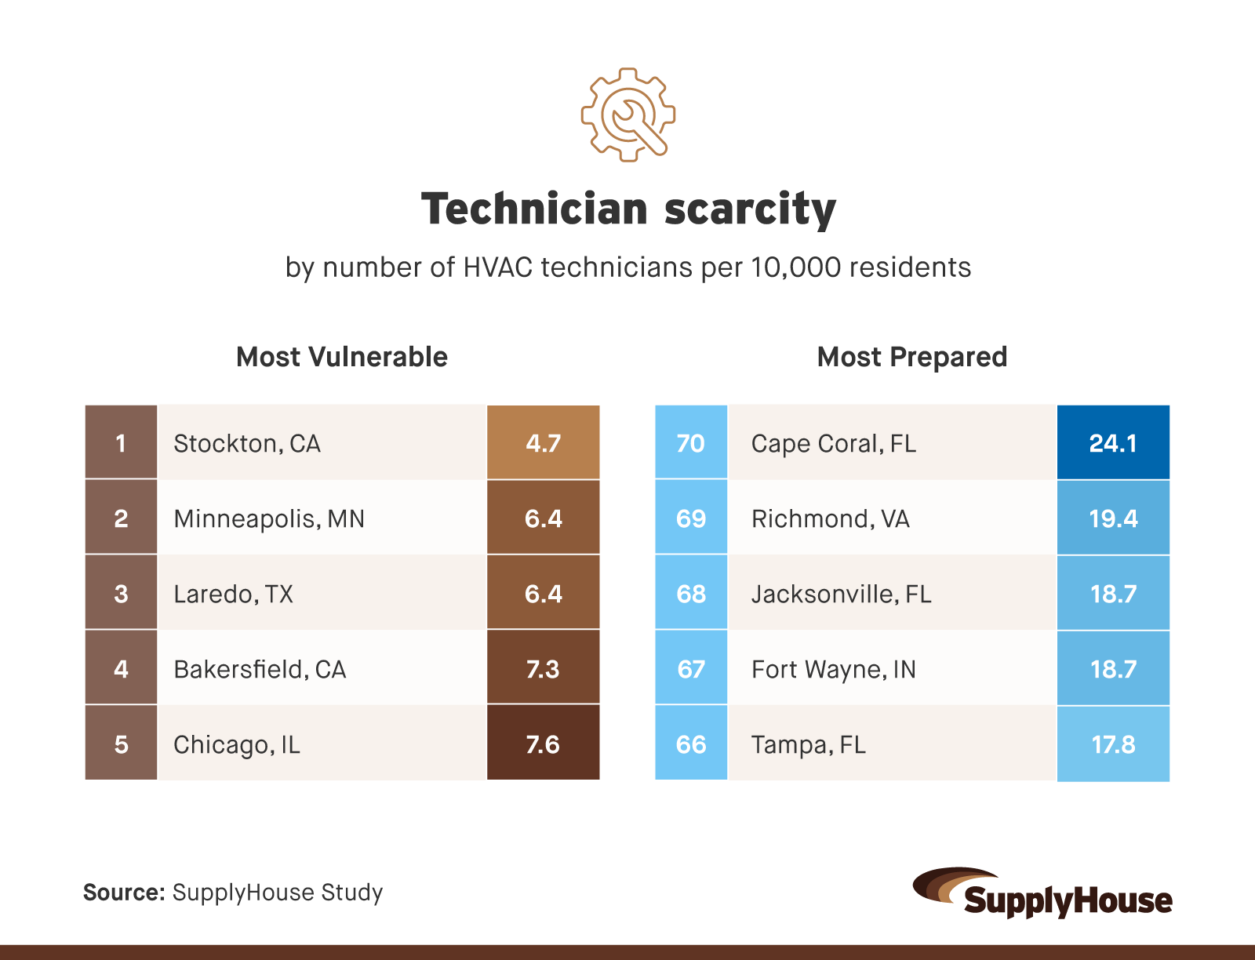
- Stockton, CA, has the fewest HVAC technicians per 10,000 residents among major metros (4.7), making it the most vulnerable on technician scarcity.
- Cape Coral, FL, is the most prepared metro on technician availability, with 24.1 HVAC technicians per 10,000 residents.
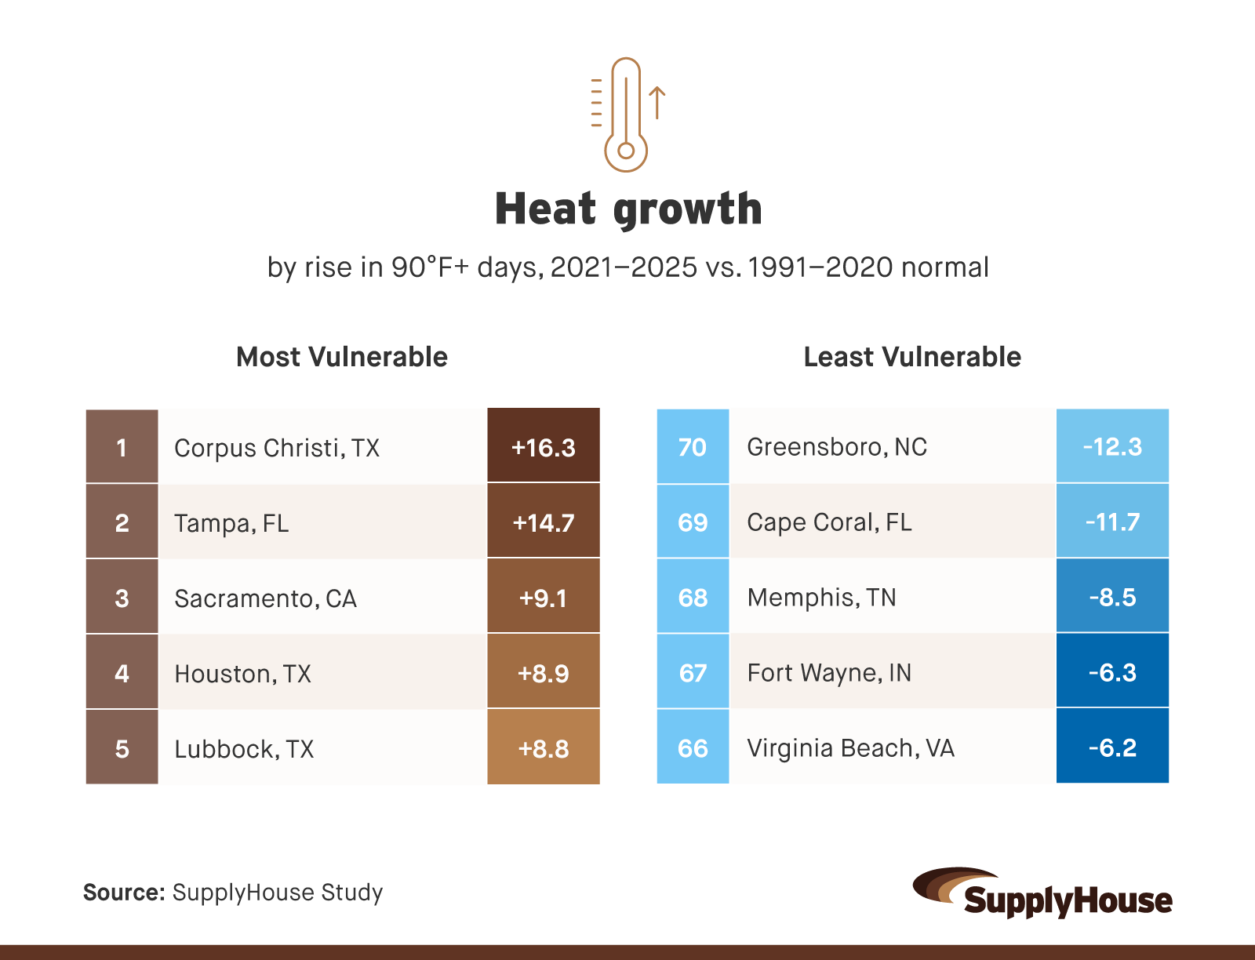
- Phoenix, AZ, is the hottest metro in America (105.2°F average summer high).
- Corpus Christi, TX, is America’s fastest-warming metro for extreme heat, adding 16.3 more days above 90°F in recent years.
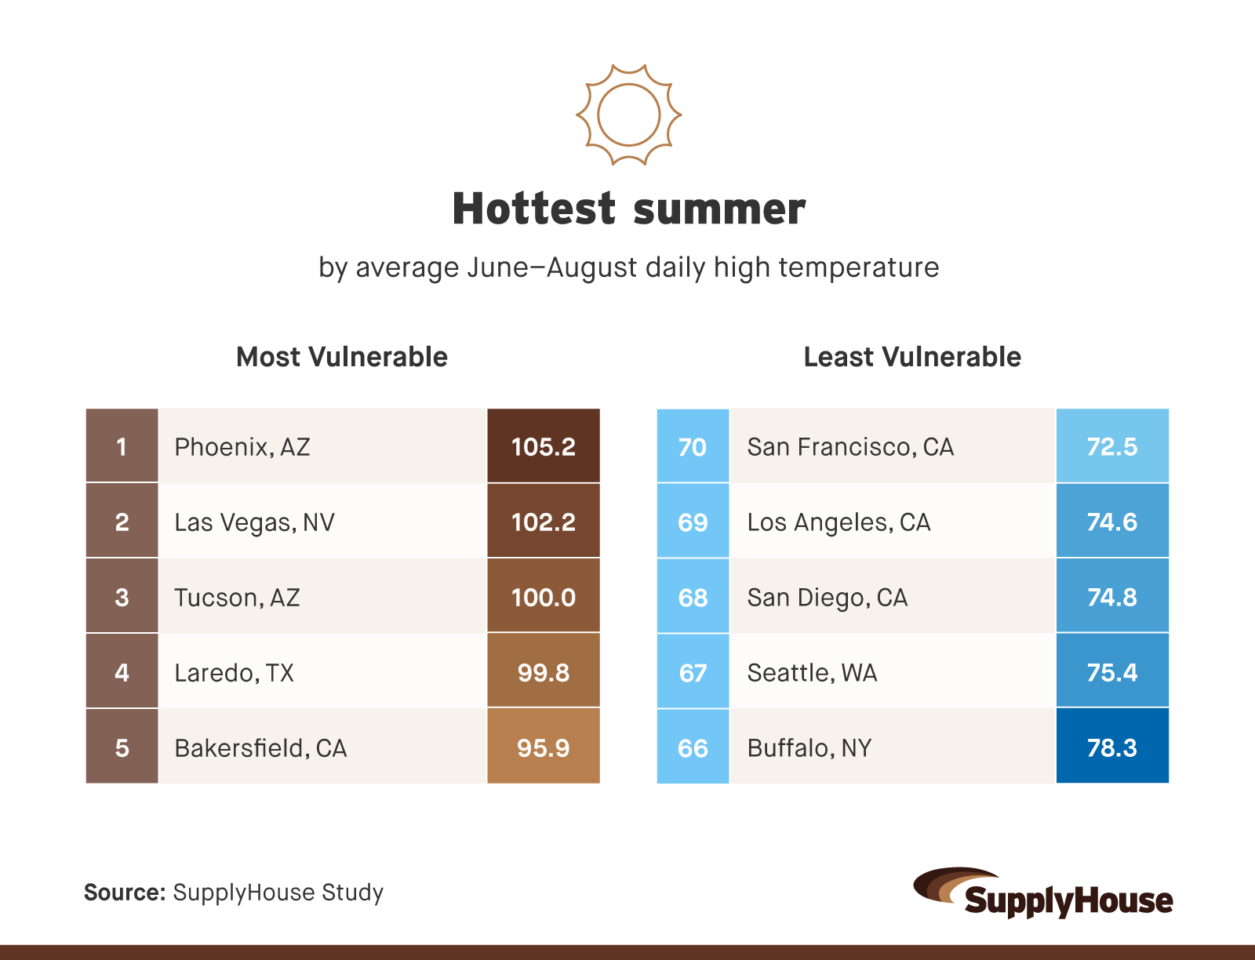
- Laredo, TX, ranks #1 overall as America’s most heat-vulnerable metro, carrying the nation’s highest heat-health vulnerability (88.8 percentile), the 4th-hottest summers (99.8°F average high), and the 3rd-thinnest HVAC workforce (6.4 technicians per 10,000 residents) of the 70 largest U.S. metros.
- Madison, WI, is the least heat-vulnerable metro, driven mainly by mild summers (80.2°F average high), one of the lowest heat-health vulnerability scores in the country (26.1 percentile), and modest cooling demand.
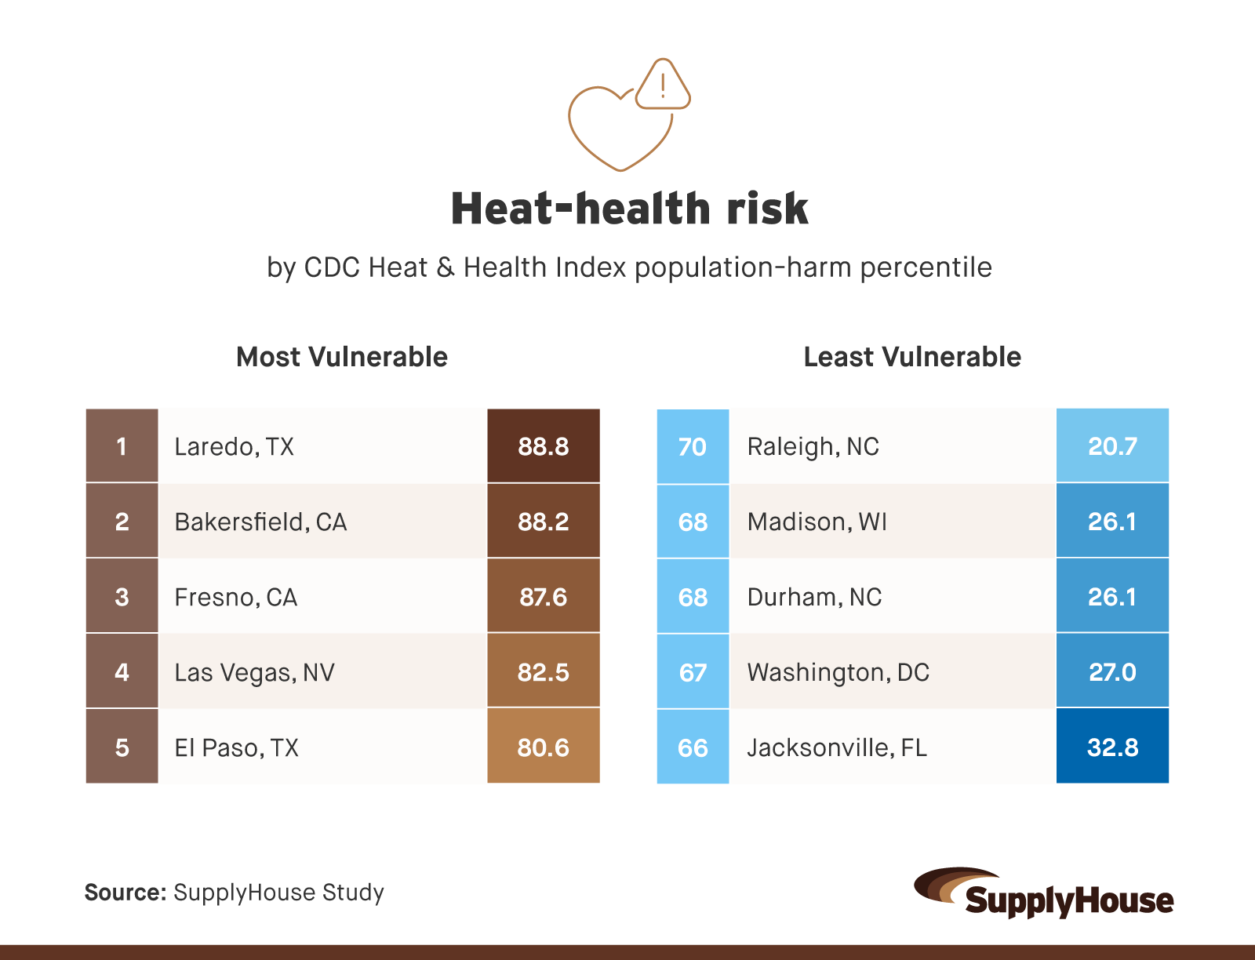
- Laredo, TX, has the highest heat-health risk score among major metros (88.8), making it the most vulnerable on this measure.
- Raleigh, NC, is the least vulnerable metro on heat-health risk, with the lowest population-harm percentile in the ranking (20.7).
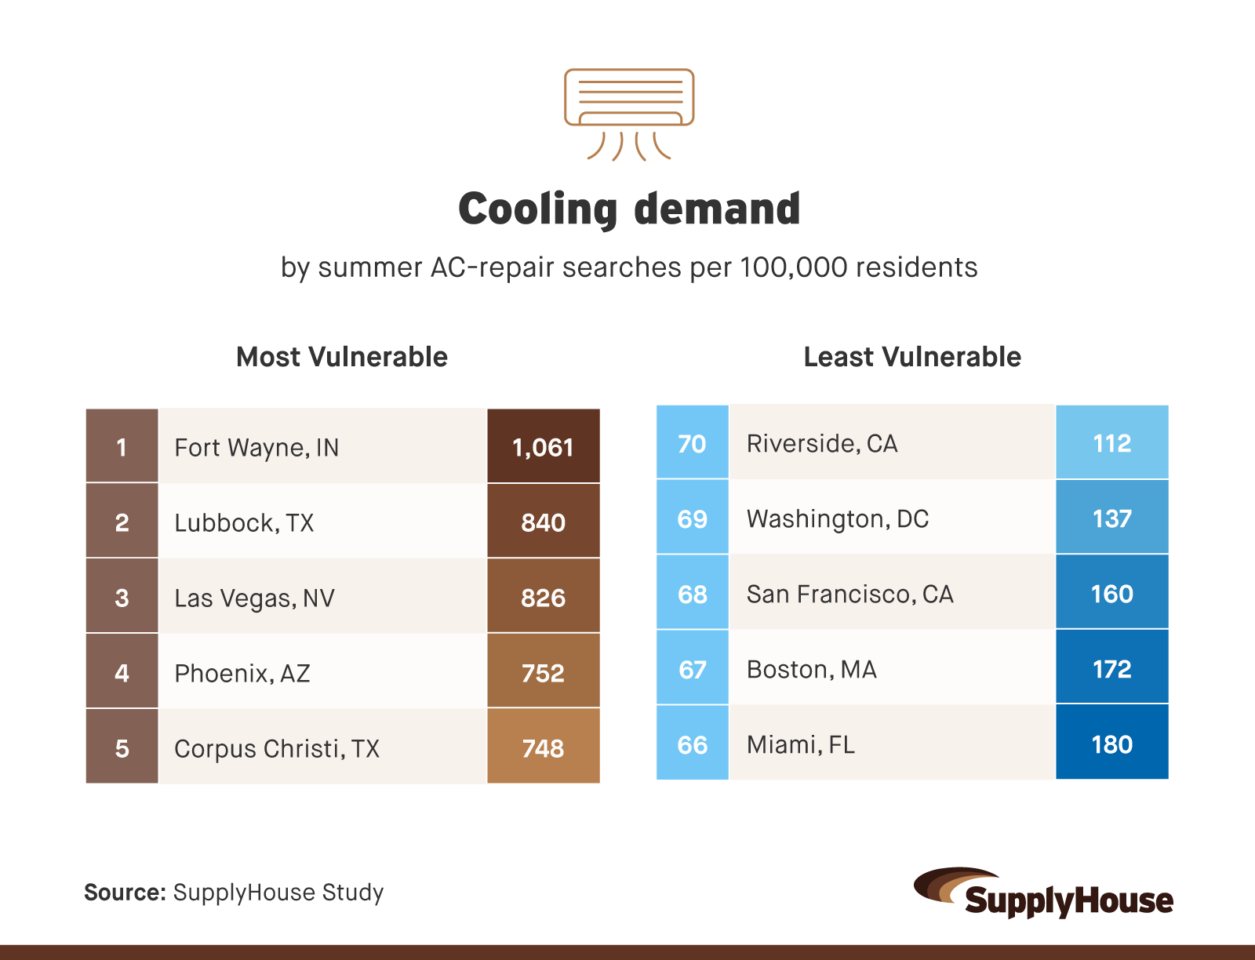
- Fort Wayne, IN, has the highest cooling demand among major metros, with 1,061 summer AC-repair searches per 100,000 residents.
- Riverside, CA, is the least vulnerable metro on cooling demand, with the lowest summer AC-repair search volume in the ranking at 112 per 100,000 residents.
Methodology
The 2026 Heat Vulnerability Index ranks the 70 largest U.S. metropolitan areas based on the climate, workforce, and public-health factors that most directly shape a community’s ability to cope with extreme summer heat. Drawing on federal climate and labor data, federal public-health data, and proprietary search-demand data, the index provides a data-driven look at which metros are most and least vulnerable for extreme heat. Rankings are relative to the 70 metros studied, and a rank of #1 indicates the most vulnerable metro.
Data sources and factors considered: The index is built on five core factors, each scaled to a point ceiling and weighted to reflect its relative importance to heat vulnerability. Each factor is min-max scaled so the most extreme metro receives the full points and the least extreme receives zero, with scores summed to a final index out of 100.
Scoring categories and weights:
- Technician Supply — 30 Points (Inverted Score)
- The number of HVAC mechanics and installers per 10,000 residents, where fewer technicians receive a higher score, since a thinner workforce is less able to meet cooling demand during heat events.
- Source: U.S. Bureau of Labor Statistics, Occupational Employment and Wage Statistics (OEWS) May 2025, SOC 49-9021; U.S. Census Bureau Population Estimates, Vintage 2025
- Heat Exposure and Growth — 38 Points
- Extreme-Heat Growth (20 Points): The change in the average number of days per year above 90°F, comparing the recent period (2021–2025) with each metro’s 1991–2020 climate normal.
- Source: NOAA NCEI, GHCN-Daily observations (2021–2025) and 1991–2020 U.S. Climate Normals
- Peak Summer Temperature (18 Points):
- The average daily high temperature across June, July, and August.
- Source: NOAA NCEI, 1991–2020 U.S. Climate Normals (JJA-TMAX-NORMAL)
- Heat-Health Vulnerability — 17 Points
- The CDC Heat & Health Index percentile, a measure of a community’s susceptibility to heat-related illness based on health, demographic, and built-environment conditions, aggregated from ZIP code to metro level.
- Source: CDC/ATSDR Heat & Health Index 2024, aggregated using the HUD USPS ZIP–CBSA Crosswalk
- Cooling Demand — 15 Points
- The volume of summer (June–September) AC-repair and emergency-cooling search activity per 100,000 residents, reflecting real-world consumer demand for cooling services during heat.
- Source: Google Trends, 25 cooling and repair terms, 2022–2025
Notes: Each metro is represented by its primary airport weather station, the standard long-term reference station for the area; NOAA reports temperature data by weather station rather than by city or metro. A single station cannot capture variation within a metro, and coastal-airport metros (notably Los Angeles, San Diego, and San Francisco) may understate inland heat exposure.
About SupplyHouse
SupplyHouse is a trusted, trades-first online supplier that combines expert-level product knowledge, fast nationwide fulfillment, and plainspoken communication to make finding and buying plumbing, heating, cooling, and electrical essentials simple and reliable for professionals and homeowners alike. When summer demand spikes, pros can grab the HVAC parts they need, in stock and ready to ship fast.
Fair Use Statement
The information in this article may be used for noncommercial purposes only. If shared, proper attribution with a link back to SupplyHouse must be included.