
Key Takeaways
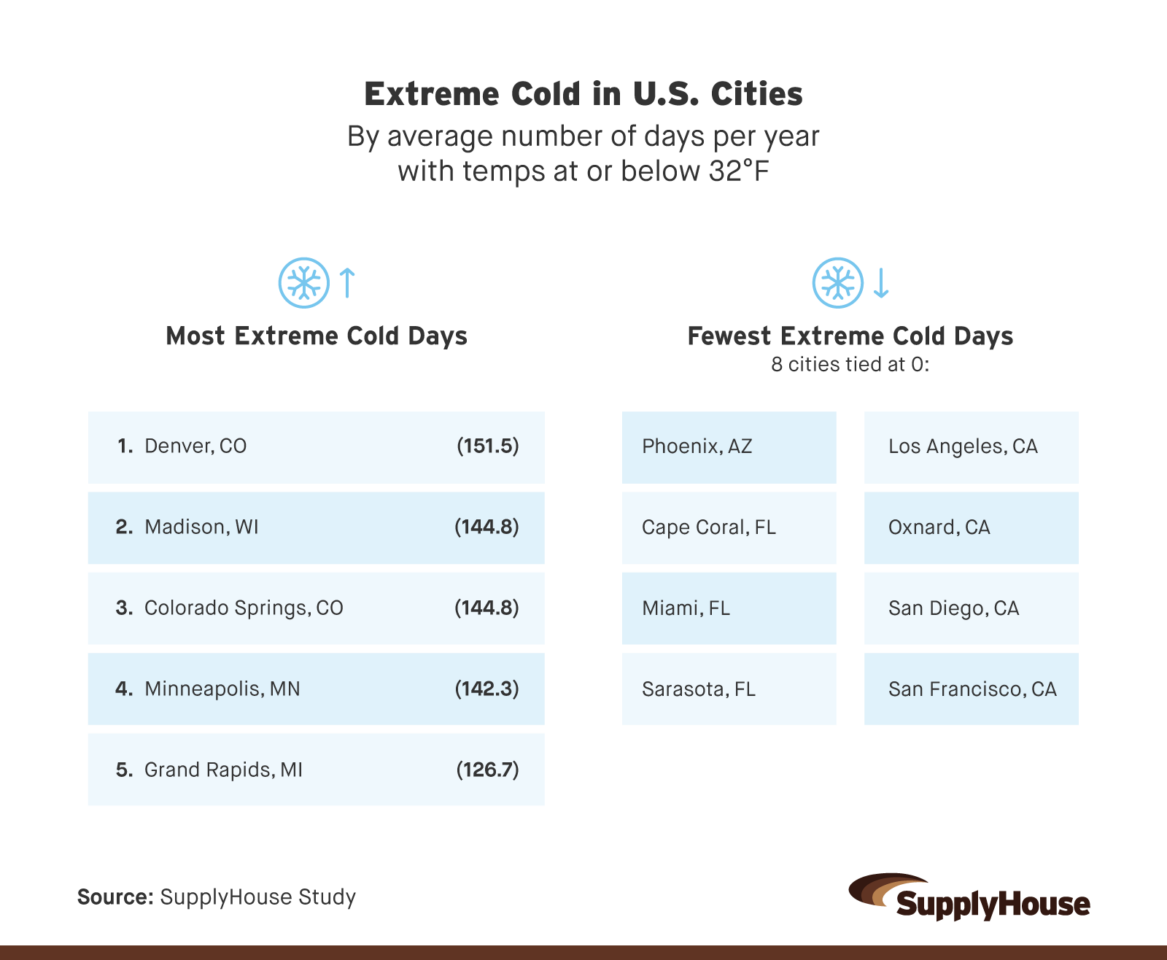
- Minneapolis, MN, ranks as the most HVAC-stressed city in the U.S., driven by the highest annual heating demand of any metro studied (7,850 heating degree days) and 142 days below freezing every year.
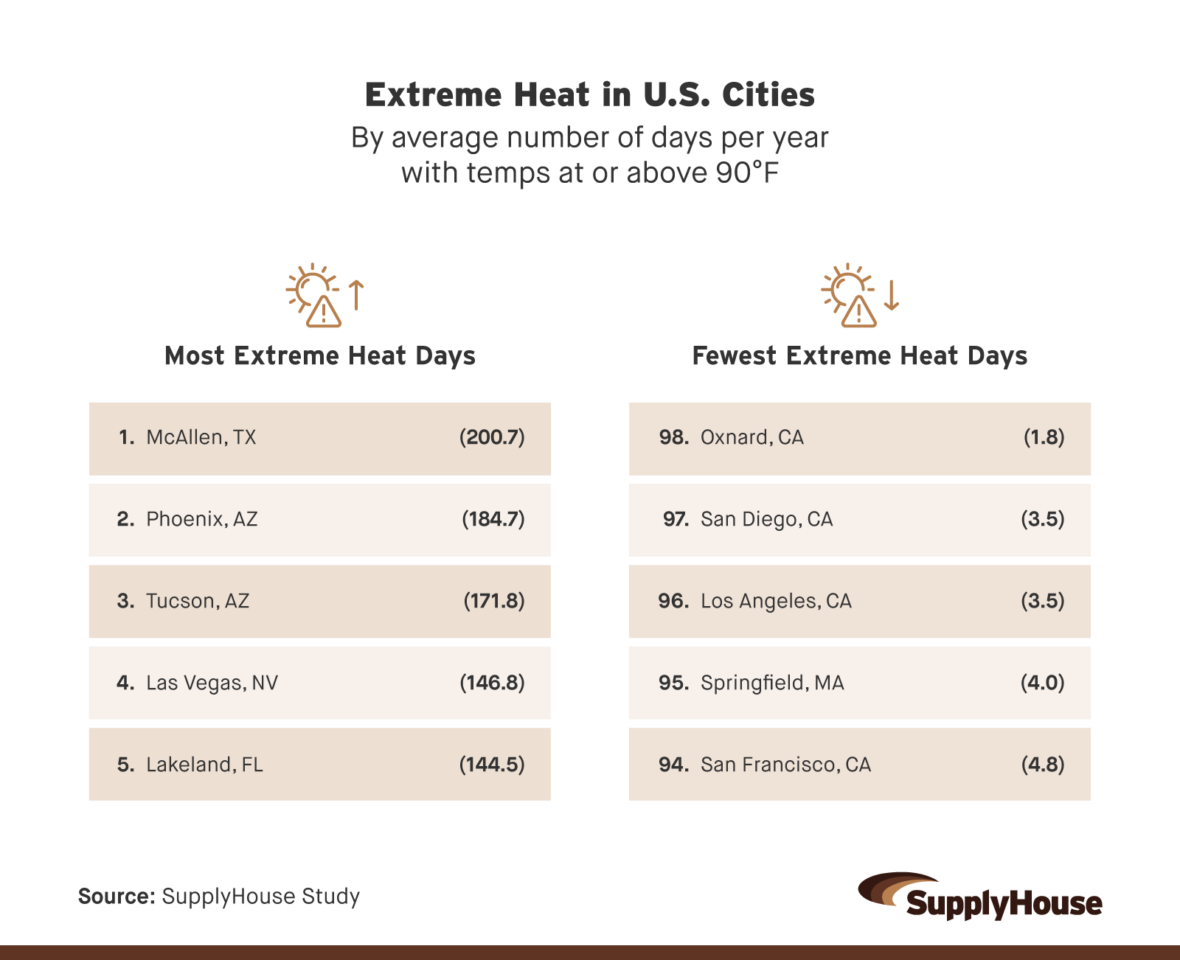
- San Francisco, CA, is the least HVAC-stressed major city in the country, with just 4.8 extreme heat days and zero freezing days annually.
- McAllen, TX, has more days above 90°F than any other U.S. metro, with 200.7 days per year. That’s more than half the calendar year with the AC running hard.
Measuring Overall HVAC Stress
Our HVAC Stress Index below ranks cities across four climate factors:
- Heating degree days (HDD)
- Cooling degree days (CDD)
- Extreme heat days (at or above 90°F)
- Freezing days (at or below 32°F)
Heating and cooling degree days measure the overall seasonal load on a system, showing how hard it has to work and for how long. HDD counts how far temperatures dip below 65°F across the year; the higher the number, the more a furnace has to work. CDD counts how far temperatures climb above 65°F. The higher the number, the harder an AC has to run. Extreme heat and freezing days capture the peaks, the days when equipment is running at or near its limits. Combining these factors gives a full picture of total climate stress.
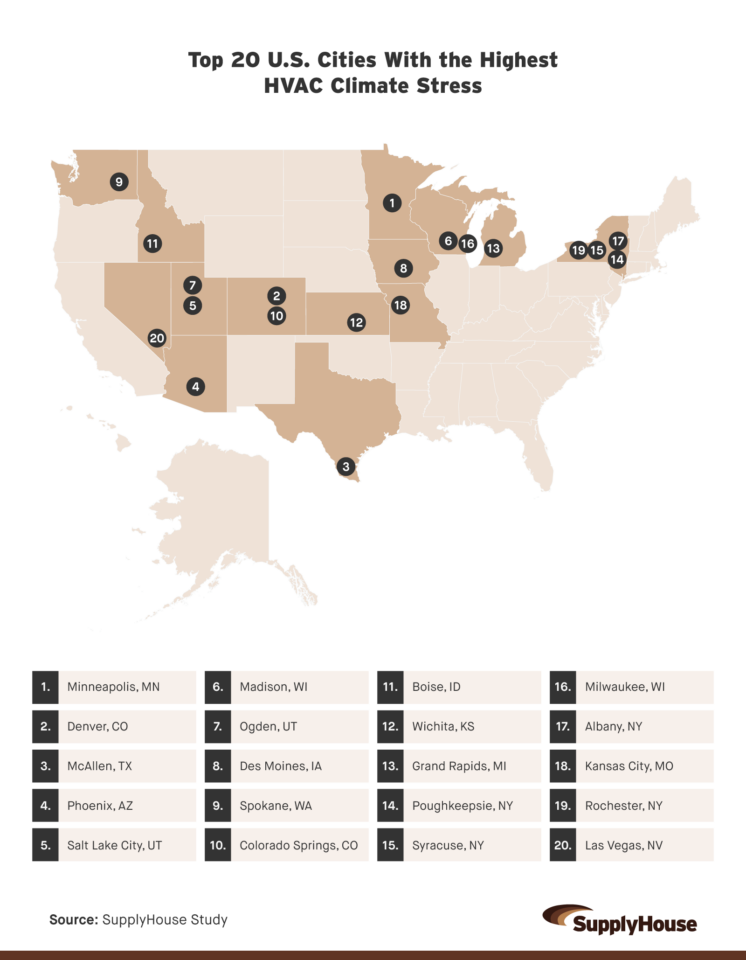
Minneapolis topped the ranking as the city with the most weather-stressful conditions for HVAC systems. With its No. 1 HDD rank and No. 4 freezing day rank, it’s a place where furnaces run long and hard. Denver ranked second, driven mostly by its cold weather, followed by McAllen, TX, where extreme heat keeps cooling systems under constant pressure.
San Francisco ranked 98th, at the bottom of the rankings, making it the least weather-stressed city overall. The city had fewer than 5 extreme heat days per year and zero freezing days. With relatively low demand across all four measures, systems face fewer spikes, shorter runtime stretches, and far less exposure to the conditions that accelerate breakdowns.
Breaking Down the Drivers of HVAC Stress
The overall rankings show where HVAC systems are under the most strain. This next breakdown looks at why. Instead of combining all factors into a single score, it separates heating demand, cooling demand, and extreme temperatures to show what’s driving that stress in each city.
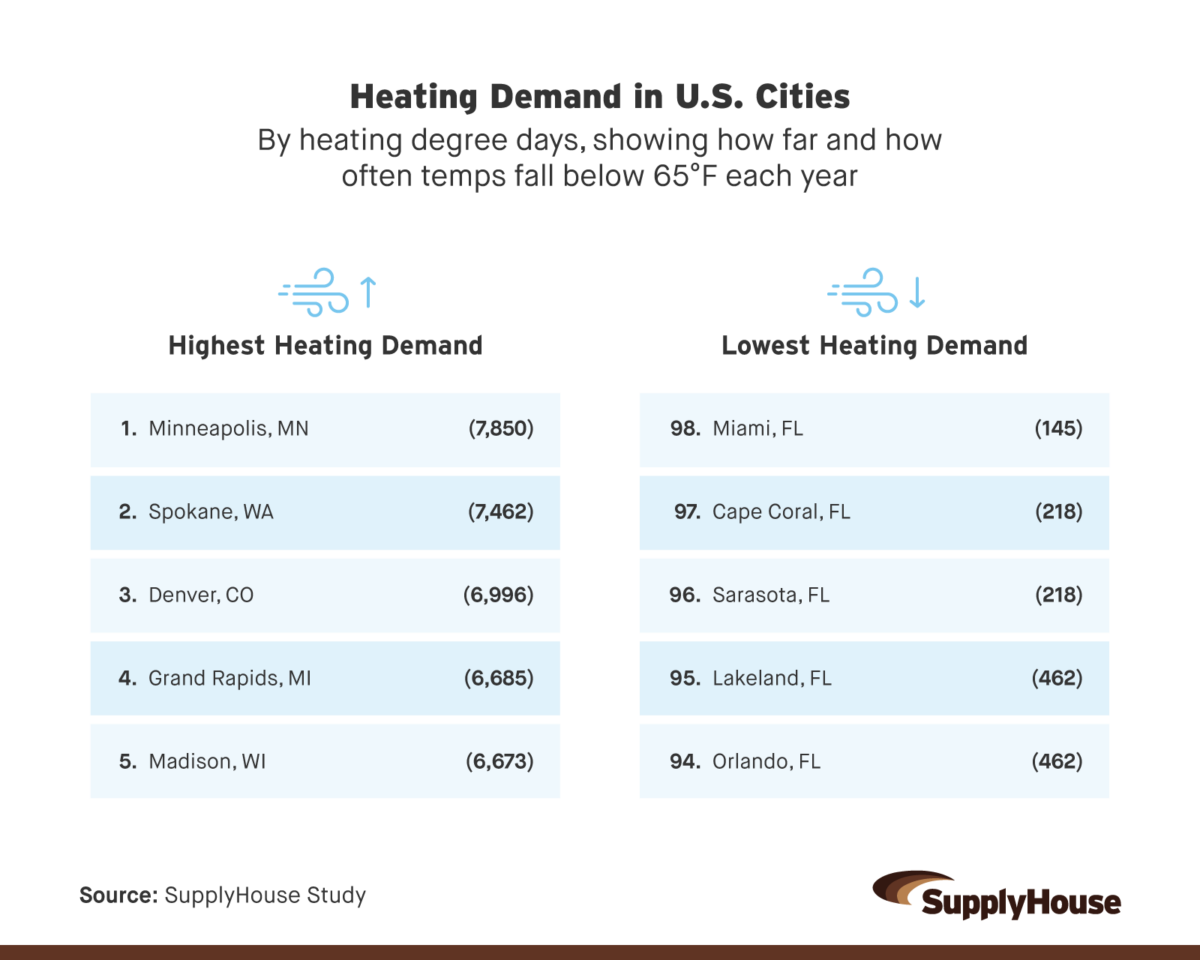
On the heating side, Minneapolis leads the country with 7,850 heating degree days, followed by Spokane and Denver. These are cities where heating systems carry the bulk of the annual workload. Long winters and consistently low temperatures keep furnaces running for extended periods, with little opportunity for downtime.
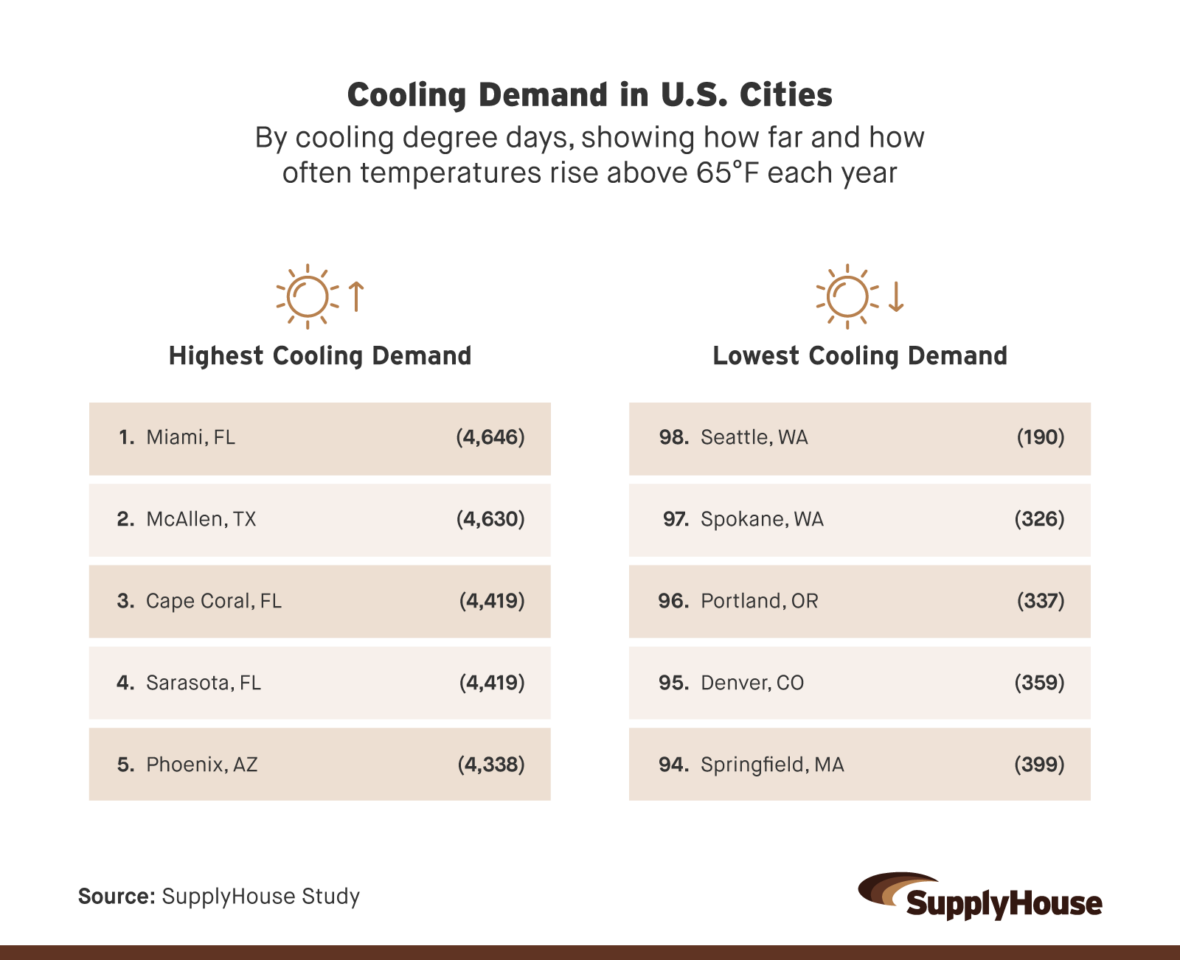
Cooling demand tells a different story. Miami ranks first in cooling degree days at 4,646, with McAllen, TX, and Cape Coral, FL, close behind. In these cities, air conditioning is a constant. Systems run frequently and for long stretches, often with little relief between cycles.
Extreme heat sharpens that pressure even further. McAllen leads with 200.7 days above 90°F each year, followed by Phoenix and Tucson, AZ. Conversely, Denver ranks first with 151.5 freezing days annually, followed by Madison, WI, and Colorado Springs, CO.
What This Means on the Job
Weather-driven HVAC stress shows up in how systems perform in the field. In high-demand cities, equipment runs longer, cycles more often, and wears out faster, leading to more service calls, more replacements, and tighter margins for error.
Whether it’s months of heating in cold climates or nonstop cooling in hot ones, the systems that hold up best are the ones sized right, installed cleanly, and built to handle the load. For contractors, that means planning for heavier runtime, staying ahead on maintenance, and using reliable equipment that can keep up when conditions push systems to their limits.
Methodology
We ranked 98 U.S. metro areas to see which cities place the greatest year-round strain on heating and cooling systems, measuring heating demand, cooling demand, extreme heat days, and freezing days using six years of NOAA climate data. This ranking is based on four climate factors tied to HVAC demand, using NOAA data from 2020 to 2025.
Core Demand Metrics
- Heating Degree Days (HDD) – 30%
Measures heating demand based on how far and how often temperatures fall below 65°F. Higher values indicate longer or colder heating seasons.
- Cooling Degree Days (CDD) – 30%
Measures cooling demand based on how far and how often temperatures rise above 65°F. Higher values indicate longer or hotter cooling seasons.
Both metrics use a 65°F base temperature, which is the standard U.S. residential benchmark below which heating is typically required and above which cooling is typically required. HDD and CDD are cumulative temperature measures, not simple day counts. A single extreme day can contribute multiple degree days depending on how far temperatures deviate from 65°F.
All HDD and CDD values were summed to annual totals for each year from 2020–2025, then averaged across the 6-year period. Each city was mapped to its corresponding NOAA climate division.
Source: NOAA National Centers for Environmental Information (NCEI), Climate at a Glance (CAG), Divisional Time Series, 2020–2025
Extreme Temperature Metrics
- Extreme Heat Days (≥ 90°F) – 20%
Average number of days per year where temperatures reached or exceeded 90°F. Captures peak cooling stress, when systems work hardest.
- Freezing Days (≤ 32°F) – 20%
Average number of days per year where temperatures dropped to or below 32°F. Captures peak heating stress and freeze risk.
Daily maximum (TMAX) and minimum (TMIN) temperatures were retrieved for each city from ThreadEx composite stations, NOAA-maintained records that blend airport and cooperative observer data to produce a continuous daily series for each metro area. Daily highs and lows were analyzed from January 1, 2020, through December 31, 2025, with annual counts averaged across the 6-year period.
Source: NOAA Applied Climate Information System (ACIS) ThreadEx, 2020–2025
Limitations
NOAA climate divisions are sub-state geographic units and do not align perfectly with metro boundaries. Where multiple metros fall within the same division, their HDD and CDD figures are identical; this applies to 13 division-sharing pairs or groups in this dataset, including Cape Coral/Sarasota (FL-05), Los Angeles/San Diego/Oxnard (CA-06), Fresno/Bakersfield/Stockton (CA-05), and others.
Extreme-temperature day counts are derived from individual station records and differ across metros within the same division, partially capturing local variation. In addition, Washington, DC, has no NOAA climate division and uses the adjacent VA-04 Northern Virginia division as a proxy; Denver’s CO-04 division includes high-elevation mountain terrain that likely inflates its HDD above what the metro core alone would produce; and Riverside uses Ontario International Airport (ONT) as a proxy station in the absence of a ThreadEx composite record.
About SupplyHouse
SupplyHouse is a trusted online supplier built for the trades, offering a wide selection of electrical, heating, cooling, and plumbing supplies backed by fast nationwide shipping and reliable inventory. With straightforward service and the parts pros need, when they need them, SupplyHouse helps contractors get the job done right.
Fair Use Statement
Feel free to use or share this information for noncommercial purposes. Please include a link back to SupplyHouse when you do.