

The purchase price is just the entry fee. Keeping a home’s plumbing, heating, cooling, and electrical systems running costs far more in some states than others, and the gap comes down to a handful of forces: what trade labor costs, how hard the climate works a furnace or an AC unit, how old the housing stock is, and how much mineral load the tap water carries.
The 2026 Home Upkeep Index scored all 50 states on those four factors using federal wage, climate, housing, and water quality data, then ranked each one out of 100 points. Where a house sits, it turns out, shapes the repair bill almost as much as how well it was built.
Key Takeaways
- Illinois ranks No. 1 overall as America’s most costly state to maintain a home.
- South Carolina is the least costly state to maintain a home, driven mainly by soft tap water, newer housing (31-year median age), and one of the mildest climates for home systems.
- Illinois has the priciest repair labor in America, where plumbers, HVAC techs, and electricians are paid an average of $92,307 a year, 90% more than in Arkansas, the cheapest state at $48,613.
- New York has the oldest housing stock in America, where the typical home is 65 years old, 52% older than the average American home (43 years).
The States Where Keeping a Home Running Costs the Most
Hard winters, aging houses, and expensive trade labor tend to travel together, and the states at the top of the index carry all three at once. At the other end of the list, the picture flips almost entirely.
Illinois topped the index with a score of 82.28, edging out Alaska at 81.58 and Minnesota at 79.62. Illinois and Minnesota combined long heating seasons with housing built generations ago, which meant furnaces, water heaters, and supply lines spent more of their service lives under stress. Alaska got there differently, pairing the harshest climate in the country with the second-priciest trade labor.
The rest of the top 10 filled in a familiar map of the Upper Midwest and the Northeast:
- Wisconsin: 76.84
- Michigan: 76.50
- Massachusetts: 75.25
- New York: 74.61
- Kansas: 73.67
- Montana: 73.57
- Connecticut: 73.42
Not one Southern state cracked the list.
South Carolina landed at the very bottom of the index with a score of 49.11, thanks to soft tap water, a housing stock with a median age of just 31 years, and one of the gentlest climates in the country for home systems. Georgia sat just above it at 49.21, followed closely by Arkansas at 49.32.
Warm-weather states swept the rest of the cheapest 10:
- North Carolina: 50.66
- Mississippi: 50.75
- Texas: 51.00
- Florida: 51.57
- Alabama: 52.23
- Nevada: 53.24
- Arizona: 53.80
Mild winters and newer construction did most of the heavy lifting in those scores, even in states where cooling loads run high for months at a time.
Labor Rates, Freeze-Thaw Cycles, and Aging Houses
No single number explains why one state costs so much more than another. Each factor in the index produced its own outlier, and those extremes say a lot about what homeowners and the pros who serve them are actually up against.
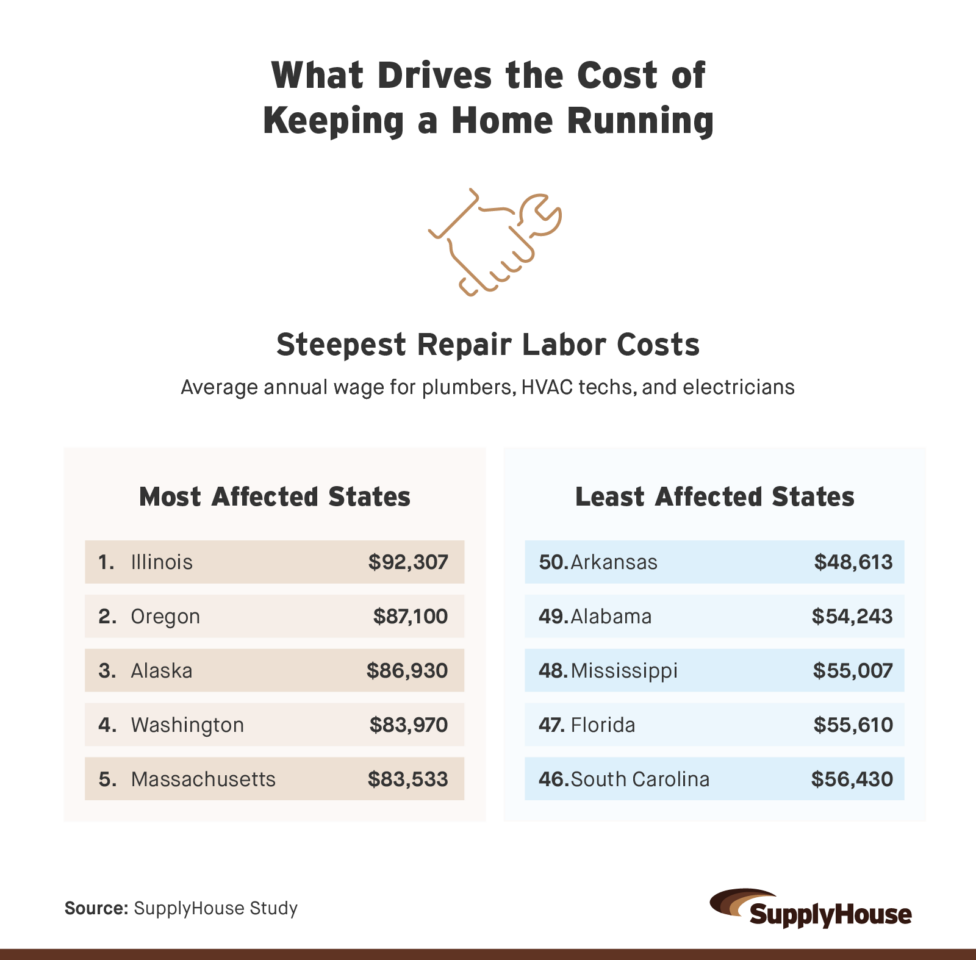
Illinois carried the priciest repair labor in the country, where plumbers, HVAC techs, and electricians earned an average of $92,307 a year. That’s 90% more than the same three trades earned in Arkansas, where the average came to $48,613. Since labor makes up the biggest line on most repair invoices, that spread showed up on every service call.
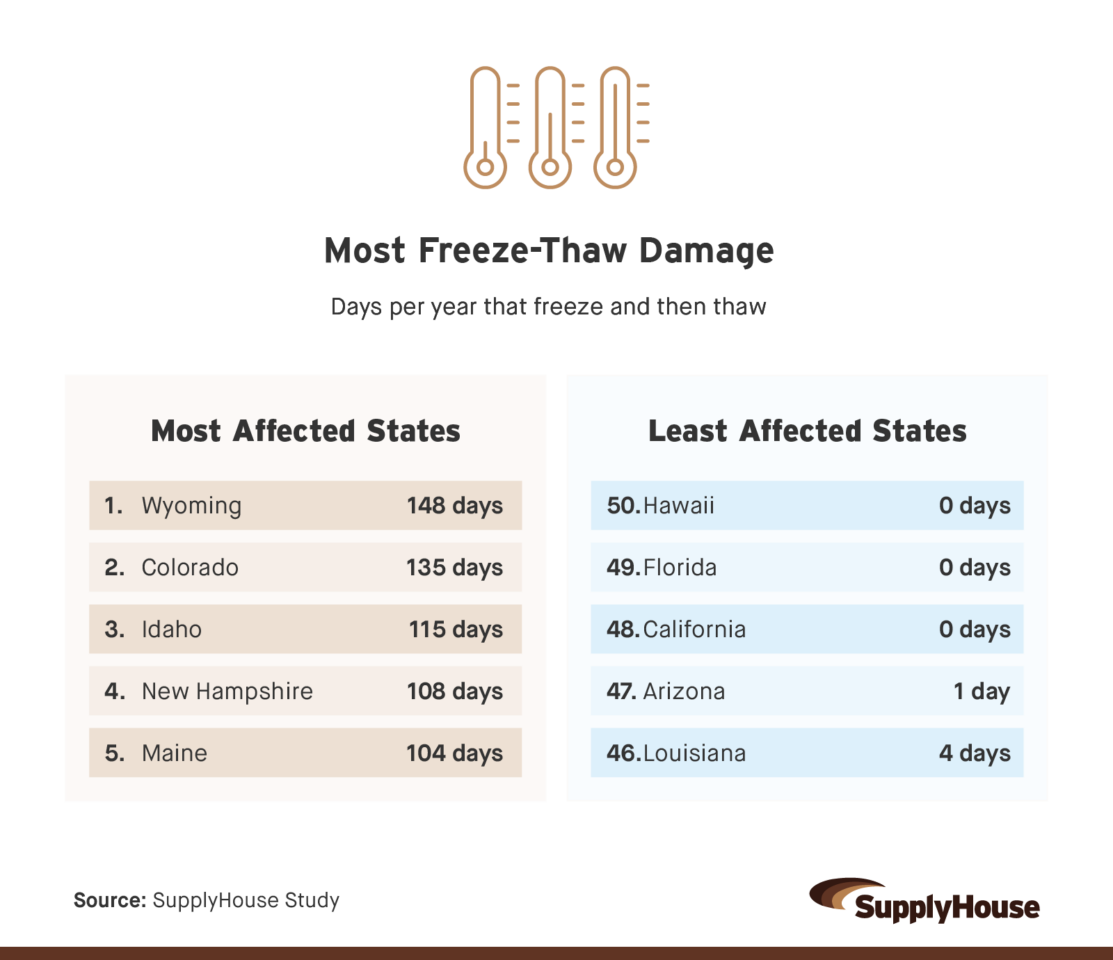
Wyoming logged more freeze-thaw cycles than any other state in the study, with 148 days a year when temperatures dropped below freezing overnight and climbed back above it by afternoon. Alaska, by comparison, recorded 83 such days. Alaska simply stays frozen; Wyoming makes pipes, joints, and fittings expand and contract over and over, which is how small leaks turn into burst lines.
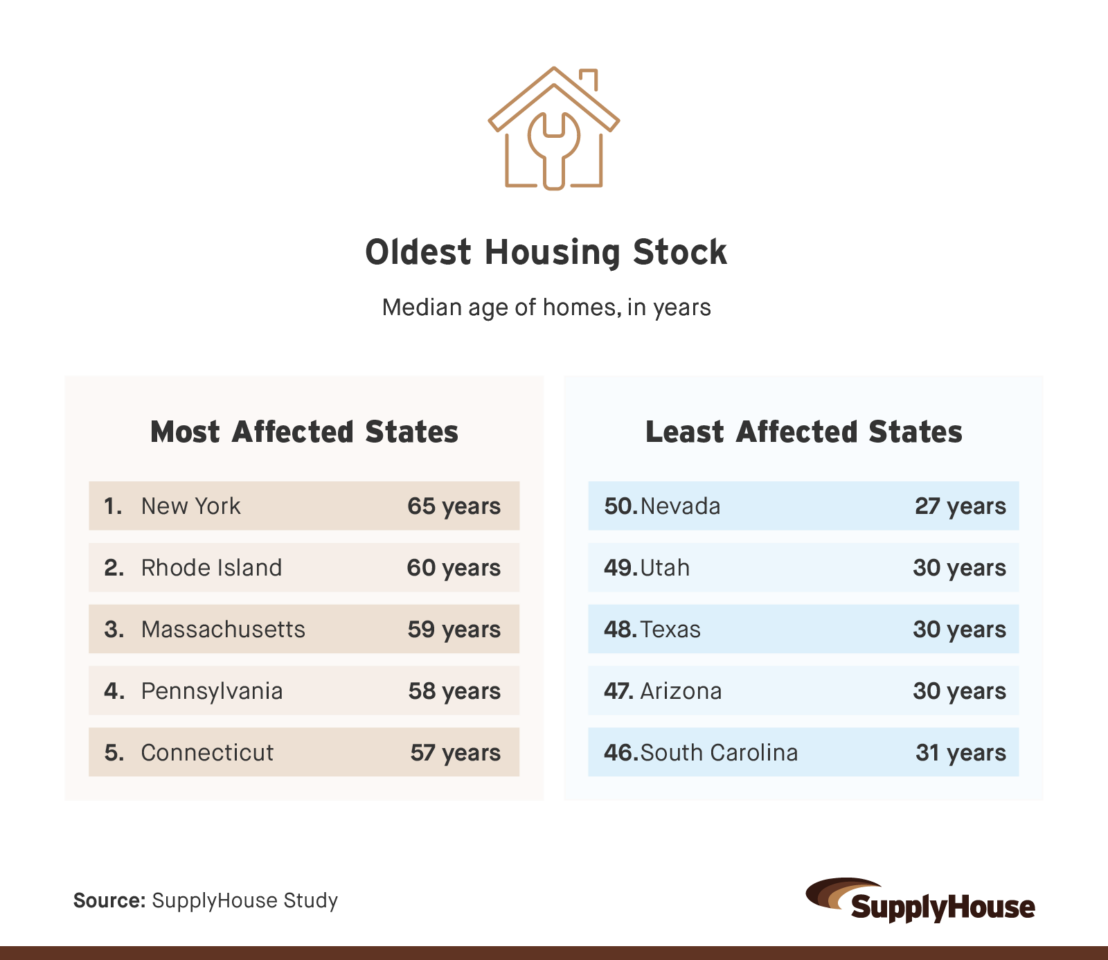
New York had the oldest housing stock in the nation, with a typical home built 65 years ago. That’s 52% older than the 43-year median for American homes overall. Houses of that vintage came with original cast-iron drains, undersized electrical panels, and decades of accumulated repairs, all of which pushed replacement onto the schedule sooner.
What This Means for Homeowners
States with harsher weather and older housing stock tend to land at the top of the cost list, while states with milder climates and newer construction come in far cheaper to maintain. Staying ahead of small issues, before they turn into bigger ones, can help prevent a big repair bill later.
Methodology
The 2026 Home Upkeep Index ranks all 50 states based on the labor, climate, housing, and water quality factors that most directly shape the long-term cost of maintaining a home’s plumbing, heating, cooling, and electrical systems. Drawing on federal wage data, federal climate data, federal housing data, and federal water quality data, the index provides a data-driven look at where keeping a home running costs the most and the least. Rankings are relative to the 50 states studied, and a rank of No. 1 indicates the most expensive state.
Data sources and factors considered: The index is built on four core factors, each scaled to a point ceiling and weighted to reflect its relative importance to home upkeep cost. Each measure is scaled against the highest state value, so the most extreme state receives the full points, with scores summed to a final index out of 100.
Scoring categories and weights:
Repair labor cost, 35 points
The median annual wage for the three trades that service a home’s core systems scored equally at 11.67 points each: plumbers and pipefitters (SOC 47-2152), heating and air conditioning mechanics (SOC 49-9021), and electricians (SOC 47-2111).
Higher wages receive a higher score, since labor is the largest share of most repair invoices. Wage figures reflect what technicians earn rather than what customers are billed and serve as a relative measure between states.
Source: U.S. Bureau of Labor Statistics, Occupational Employment and Wage Statistics (OEWS) May 2025.
Climate stress, 29 points
Climate stress was split across three factors:
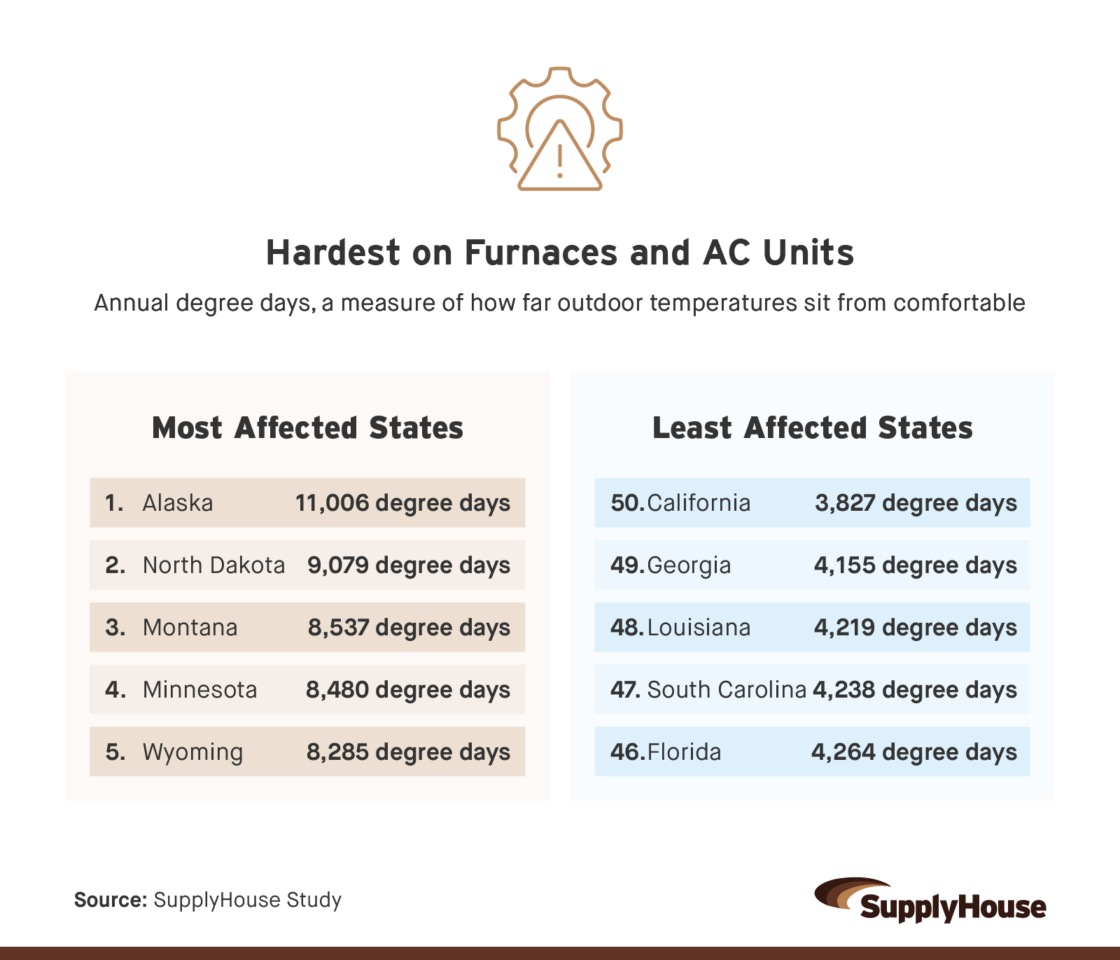
- Thermal workload (18 points): Annual heating and cooling degree days, base 65°F, summed as raw values so that both very cold and very hot states score above mild ones. Source: NOAA National Centers for Environmental Information, via the EIA State Energy Data System.
- Freeze-thaw cycles (6 points): The annual number of days that fall to freezing overnight and rise above freezing during the day, derived as days with a minimum at or below 32°F minus days with a maximum at or below 32°F. Source: NOAA NCEI, 1991–2020 U.S. Climate Normals (monthly).
- Humidity (5 points): Average annual relative humidity from hourly surface observations. Source: NOAA hourly surface observations (ASOS).
Housing stock age, 24 points
The median age of housing units, where older stock receives a higher score, since aging homes need more frequent repair and system replacement. Source: U.S. Census Bureau, American Community Survey 2024 1-Year Estimates.
Water hardness, 12 points
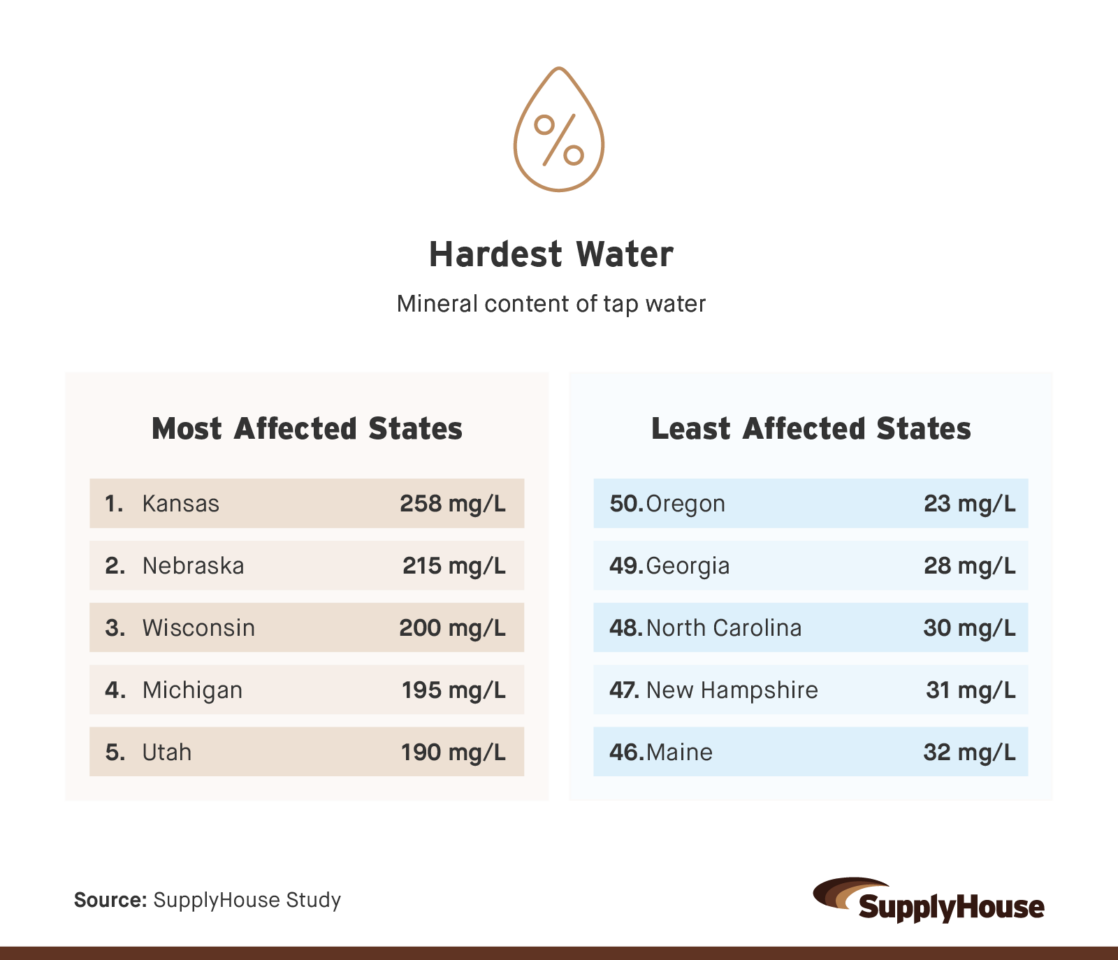
The median mineral content of municipal tap water in milligrams per liter of calcium carbonate, where harder water receives a higher score, since scale buildup shortens the life of water heaters, fixtures, and pipes. Source: EPA Safe Drinking Water Information System and Utility Consumer Confidence Reports.
About SupplyHouse
SupplyHouse is a trusted, trades-first online supplier that combines expert-level product knowledge, fast nationwide fulfillment, and plainspoken communication to make finding and buying plumbing, heating, cooling, and electrical essentials simple and reliable for professionals and homeowners alike.
Fair Use Statement
The information in this article may be used for noncommercial purposes only. If shared, proper attribution with a link back to SupplyHouse must be included.