

Skilled trades are local work. Where you live — or where you’re willing to go — can shape your pay, access to training, and how steady the work really is.
To see which cities are best set up for skilled trades in 2026, SupplyHouse ranked the 50 most-populated U.S. cities by mapping each one to its metro area and scoring six factors: workforce density, training access, salary, job growth, union coverage, and cost of living.
Those scores were combined into a single ranking that highlights where tradespeople have the most support on and off the job.
Key Takeaways
- Omaha (#1), Phoenix (#2), and Nashville (#3) rank as the strongest U.S. cities for skilled trades overall.
- The cities with the highest concentration of licensed trade professionals per 100,000 residents are Virginia Beach (791), Omaha (756), and Phoenix (679).
- Chicago (42), Miami (33), and Houston (33) offer the most trade-related training programs, while Louisville (3), El Paso (3), and Austin (3) offer the fewest.
- Nashville (7.2%), Atlanta (6.6%), and Phoenix (6.5%) saw the strongest construction job growth from 2019 to 2024, while Baltimore (-1.0%), New York City (-0.5%), and Chicago (-0.5%) experience losses.
- The cities with the highest cost-of-living scores are San Francisco (118), Louisville (115), and San Jose (113), all above the U.S. average of 100. Wichita (89), Tulsa (89), and Columbus (90) are the most affordable cities.
Best U.S. Cities for Skilled Trades
The table below shows how each city stacks up across the factors we looked at for skilled trades work. You can scan the rankings and sort by category to see how places compare.
Top 10 Cities With the Strongest Skilled Trades Workforce Overall
- Omaha, NE
- Phoenix, AZ
- Nashville, TN
- Charlotte, NC
- Mesa, AZ
- Philadelphia, PA
- Raleigh, NC
- Boston, MA
- Louisville, KY
- Milwaukee, WI
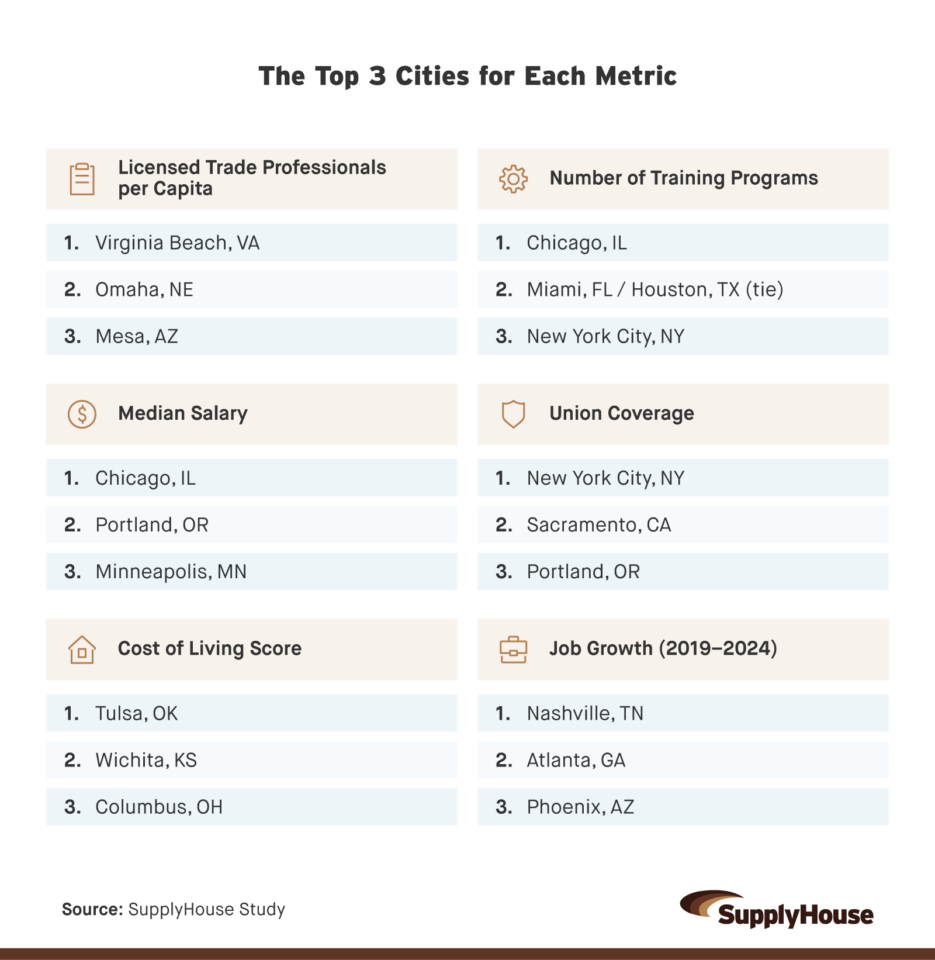
Top Cities by Metric and Where Opportunity Is Building
Rather than relying on one overall score, these callouts spotlight the metros that lead across key workforce factors: trade density, training access, pay, growth momentum, and affordability.
Licensed Trade Professionals per 100,000 Residents
Top 3
- Virginia Beach, VA: 791 per 100K
- Omaha, NE: 756 per 100K
- Phoenix / Mesa, AZ (tie): 679 per 100K
Bottom 3
- Fresno, CA: 50 per 100K
- Las Vegas, NV: 99 per 100K
- El Paso, TX: 324 per 100K
Number of Training Programs
Top 3
- Chicago, IL: 42
- Miami, FL / Houston, TX (tie): 33
- New York, NY: 32
Median Salary
Top 3
- Chicago, IL: $95,125
- Portland, OR: $95,035
- Minneapolis, MN: $92,005
Job Growth (2019–2024)
Top 3
- Nashville, TN: +7.2%
- Atlanta, GA: +6.6%
- Phoenix, AZ / Mesa, AZ (tie): +6.5%
Union Presence (Worker Coverage %)
Top 3
- New York, NY: 21%
- Sacramento, CA: 20%
- Portland, OR: 18%
Cost of Living Score
Top 3
- Tulsa, OK / Wichita, KS (tie): 89
- Columbus, OH: 90
- Oakland, CA: 91
Methodology
This ranking looks at how well the 50 most populated US cities are set up for skilled trades work. Each city was matched to its surrounding metro area (CBSA/MSA), since most workforce, pay, and training data is tracked at the metro level. When multiple cities share the same metro, such as Phoenix and Mesa, they use the same underlying data.
Each city was scored across six metrics tied to workforce strength, earning potential, job demand, and affordability. Those scores were scaled, weighted, and combined into a single composite score to produce the final rankings.
1. Core Trades Workforce per Capita
To measure how concentrated the skilled trades workforce is in each metro, we looked at employment in three core occupations:
- Electricians
- Plumbers, pipefitters & steamfitters
- HVAC mechanics & installers
We added total employment across these roles for each metro, then calculated how many core trades workers exist per 100,000 residents:
Core trades per 100,000 = (Total core trades employment ÷ Metro population) × 100,000
Source: BLS Occupational Employment and Wage Statistics (OEWS)
2. Training Program Availability
To assess the training pipeline, we counted the number of trade-related postsecondary programs available in each metro. Programs were identified using trade-aligned Classification of Instructional Programs (CIP) codes and tied to institutions located within each metro area.
Program count = Total number of qualifying trade-related programs in the metro area
Source: College Scorecard Field of Study data
3. Median Salary
To reflect earning potential, we calculated an employment-weighted median annual wage across the same three core trades. Weighting prevents any single occupation from skewing the results and provides a more accurate picture of overall pay.
Source: BLS OEWS
4. Construction Establishment Growth (2019–2024)
To measure job momentum and demand, we used growth in construction establishments as a proxy. We compared the number of construction businesses under NAICS code 23 in each metro in 2019 and 2024, then calculated the percent change:
Job growth % = ((Establishments 2024 – Establishments 2019) ÷ Establishments 2019) × 100
Source: BLS Quarterly Census of Employment and Wages (QCEW)
5. Union Presence
Union presence was measured using union coverage rates, which include both union members and nonmembers covered by union contracts. This metric reflects how much of the local workforce operates under collective bargaining agreements.
Union coverage % = share of employed workers covered by a union contract
Source: CPS via IPUMS
6. Cost of Living/Purchasing Power
To measure affordability, we used Bureau of Economic Analysis (BEA) Regional Price Parities to estimate how far earnings go in each metro. Higher scores indicate a lower cost of living (more purchasing power), while lower scores indicate a higher cost of living (less purchasing power).
Source: BEA Regional Price Parities
Scoring & Ranking
Each metric was min–max scaled so that the top-performing city received the highest score and the lowest-performing city received the lowest score, with all other cities scored in between. Metrics were then weighted and combined as follows for a final score per city:
- Core Trades Workforce per Capita: 30 points
- Training Program Availability: 15 points
- Median Salary: 20 points
- Construction Establishment Growth: 15 points
- Union Presence (Coverage %): 10 points
- Cost of Living / Purchasing Power: 10 points
Final scores represent the sum of all weighted metrics. Cities were ranked from highest to lowest final score to determine the standings from 1 to 50.
About SupplyHouse
SupplyHouse is a trades-first online supplier built for people who work with their hands and don’t have time to mess around. We pair deep product knowledge with fast, nationwide delivery and straight-talk communication, so buying things like plumbing supplies and HVAC parts stays simple and reliable.
Whether you’re bouncing between jobs or knocking out a project at home, we make it easy to find the right parts, check specs quickly, and get what you need when you need it. No runaround. No guesswork. Learn more at SupplyHouse.com.
Fair Use Statement
This content is for informational purposes and is based on publicly available data and original analysis. You may reference or share this data with attribution and a link to SupplyHouse.